Forward Performance Tracking
What this page is
This page documents forward performance tracking — a running record of how live trading behaves relative to historical expectations.
It is not a forecast, not a guarantee, and not a performance summary.
It is documentation.
Each update compares:
- demo backtests (optimistic execution assumptions)
- live-account backtests (more conservative execution assumptions)
- actual live trades
Full context and explanation are provided in the accompanying videos.
How to read these charts
Backtests and live trading behave differently.
- Demo backtests assume cleaner execution
- Live-account backtests reflect spreads, slippage, and timing
- Actual trades show what happened in reality
The goal is not for live trading to match optimistic backtests,
but to remain consistent with conservative expectations over time.
Forward Performance Tracking Log
FPT #001 — Demo vs Live Backtests + Actual
Date: January 2026
This first entry establishes the baseline.
It shows:
- the difference between demo and live backtest assumptions
- how Engines A and B behave under both
- how actual trades compare since public launch
Video explanation:
👉 Forward Performance Tracking #1 — Demo vs Live Backtests Explained
Equity curve:
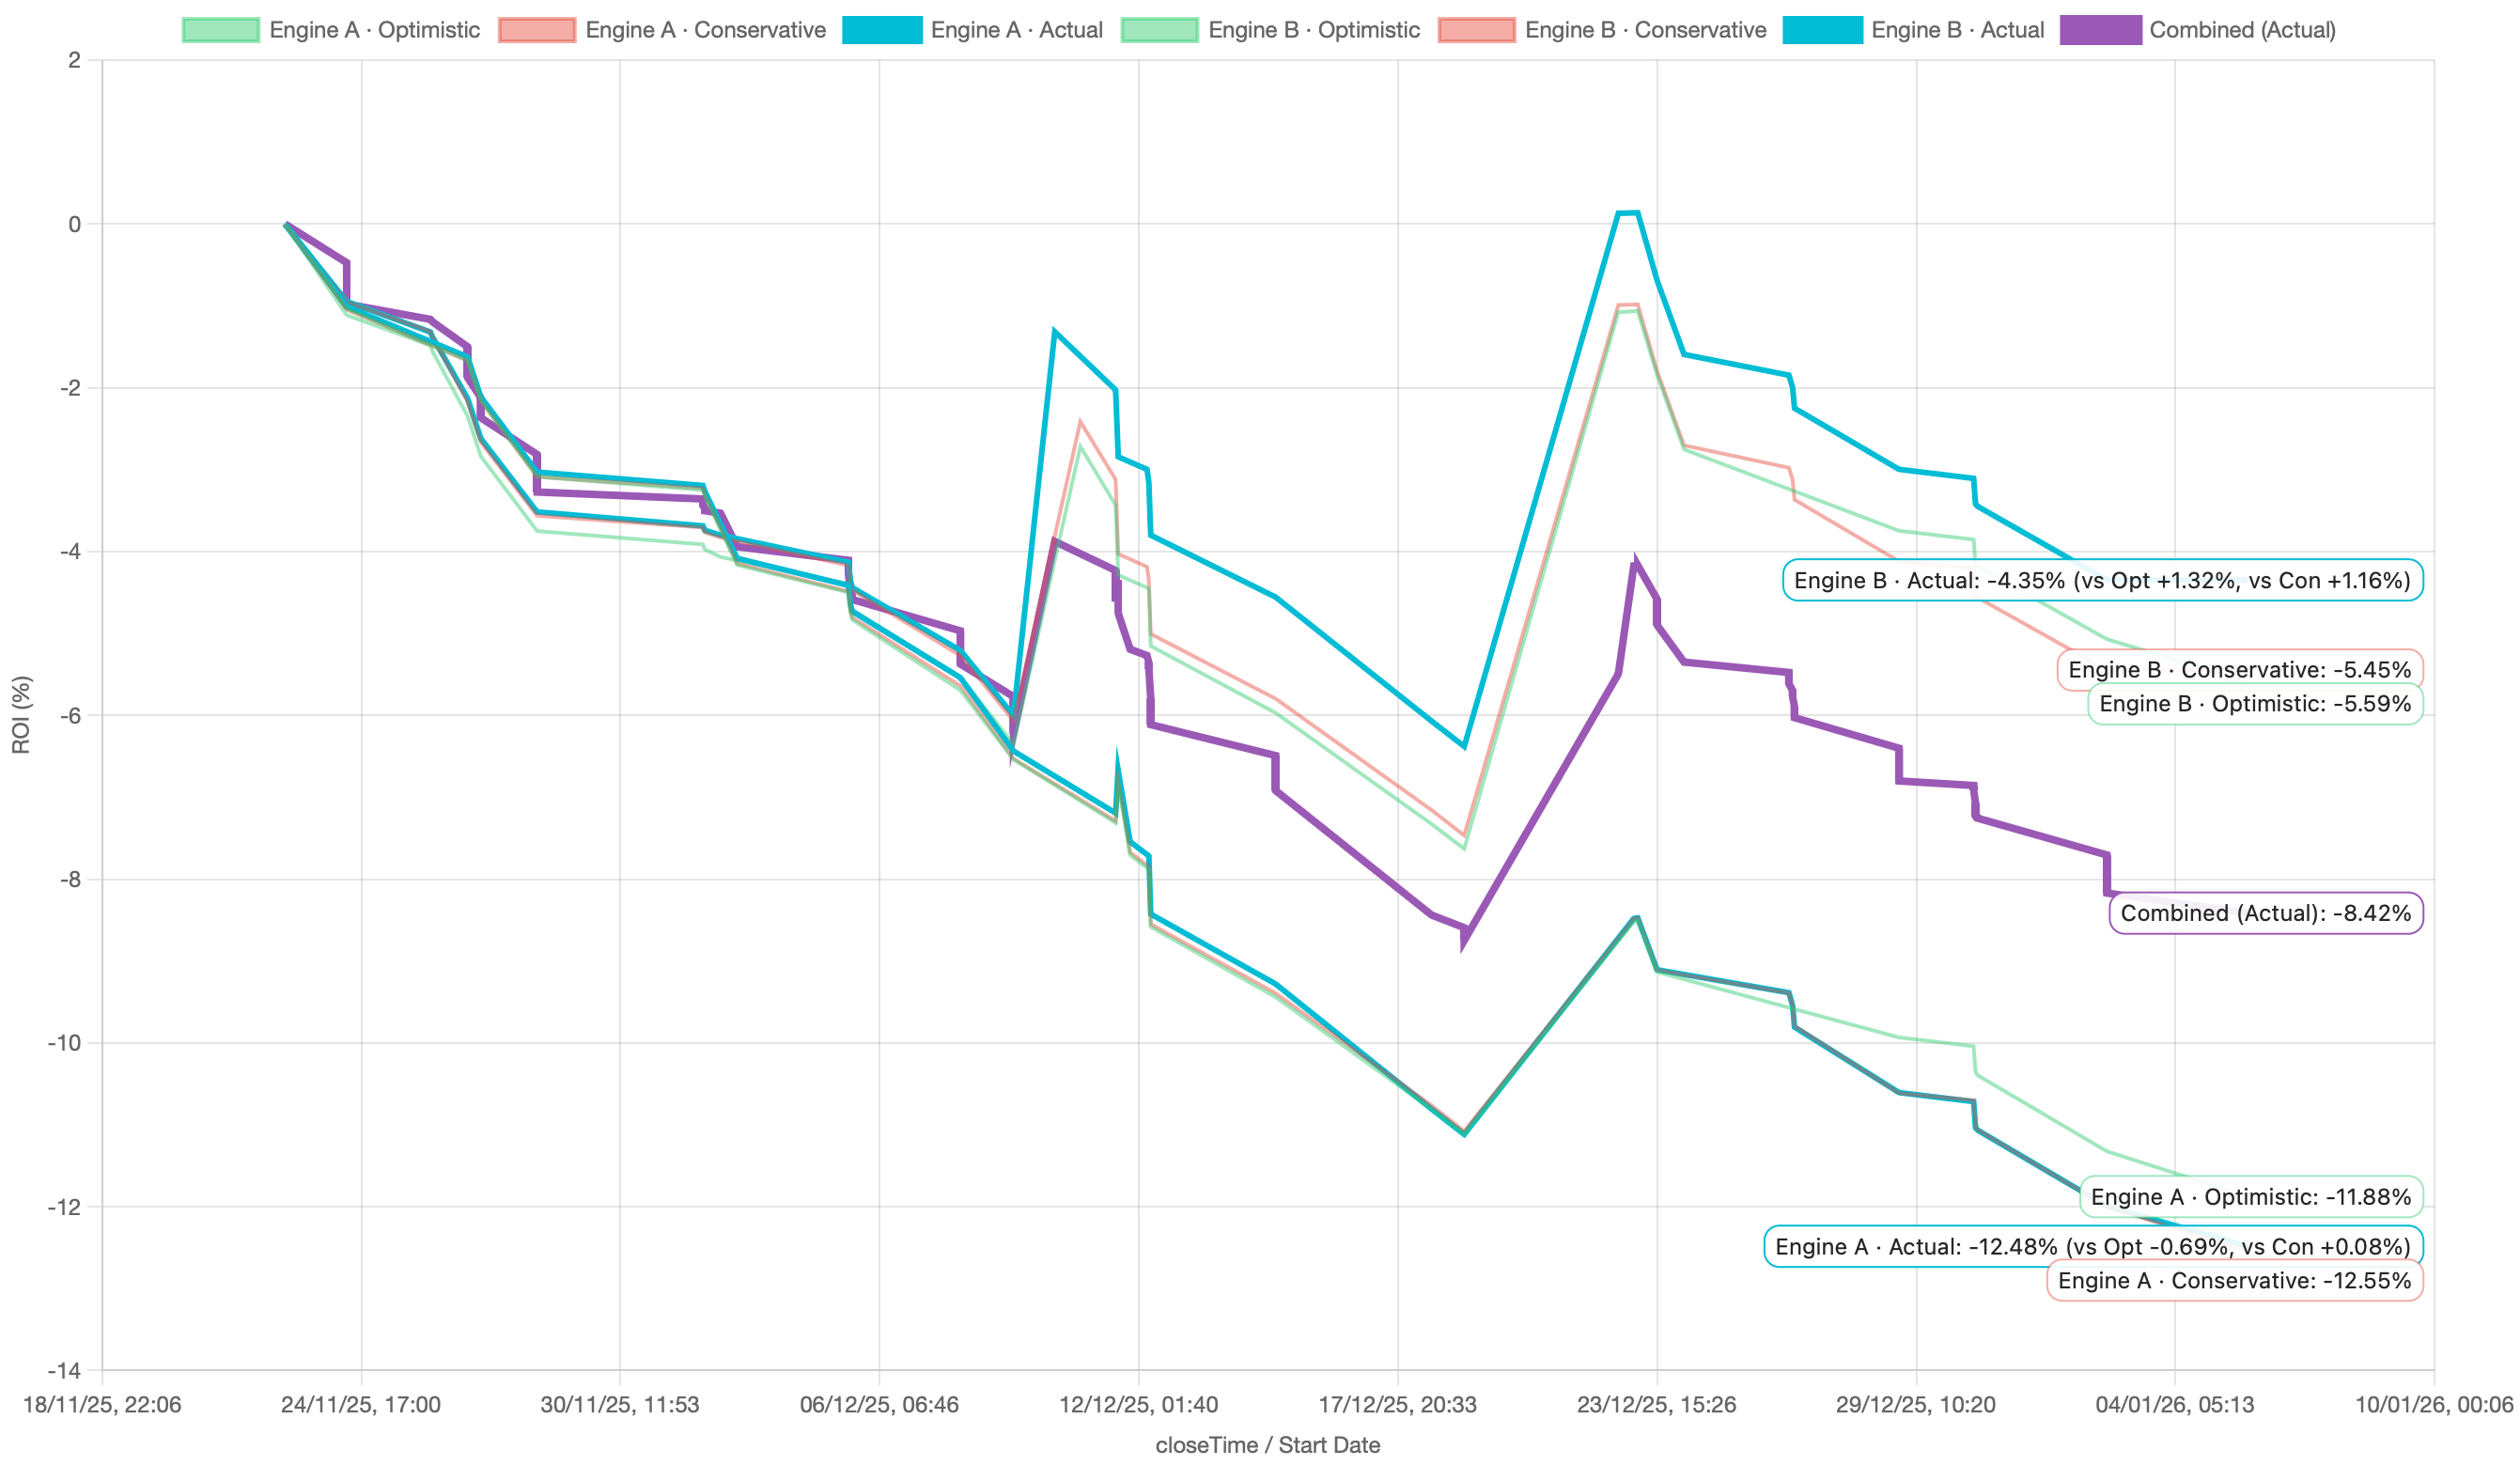
This chart is updated as new live data becomes available.
It represents documentation, not prediction.
Update cadence
This page is updated periodically as new Forward Performance Tracking episodes are published.
Each entry follows the same process:
- same engines
- same metrics
- same assumptions
- no changes after the fact
Relationship to the Quant Report
The Quant Report explains what was built and how it was tested.
Forward Performance Tracking documents what happens next.
If you’re looking for system design, validation, and assumptions, start there.
If you’re looking for live behavior over time, you’re in the right place.
All results shown are hypothetical backtests unless stated otherwise.
Past performance does not guarantee future results.